


Abstract
Background: Combining testing for natriuretic peptides [amino-terminal pro–brain natriuretic peptide (NT-proBNP) and brain natriuretic peptide (BNP)] and cardiac troponin T (cTnT) may help predict mortality in patients with acute heart failure (HF).
Methods: We studied 209 patients with acute HF at an urban academic center and used ROC curves and multivariate analyses to examine the relationship of outcome to natriuretic peptide and cTnT concentrations at presentation.
Results: Higher concentrations of natriuretic peptides and cTnT at presentation were predictors of death at 60 days and 1 year (P <0.001 and P <0.01, respectively, at both time points). Optimal cutoff points for NT-proBNP, BNP, and cTnT for predicting death by 60 days or 1 year were 5562 and 3174 ng/L, 428 and 352 ng/L, and 0.01 and 0.01 μg/L, respectively. Most decedents demonstrated increased concentrations of both natriuretic peptides and cTnT and had a 25% mortality rate at the 60-day time point (P <0.001). Mortality rates were low (<4%) among patients with either no increase or an increase in only 1 marker. Decedents with increases in both a natriuretic peptide and cTnT at presentation had the highest death rate at 1 year (45%, P <0.001). This combination was strongly predictive of death [NT-proBNP plus cTnT: hazard ratio (HR), 7.66; 95% confidence interval (CI), 3.06–17.8; BNP plus cTnT: HR, 6.82; 95% CI, 2.99–16.5].
Conclusions: A dual-marker strategy incorporating a natriuretic peptide and cTnT is superior to either marker alone for estimating short- and longer-term risk in patients with acute HF.
Despite effective therapies, heart failure (HF)1 patients continue to experience high morbidity and mortality, with millions of patients hospitalized yearly with acutely decompensated HF. Furthermore, many recently hospitalized patients with acute HF are rehospitalized or die within the first 6 months (1). Recognizing such higher-risk patients, however, may be challenging, and clinicians have sought a reliable, reproducible method for estimating short- and longer-term risk in the setting of acute HF.
Clinical variables, such as renal function or systolic blood pressure measurements, may be simple tools for short-term risk stratification of patients with decompensated HF (2). Cardiac biomarker measurement, either individually or in various combinations, has been evaluated for acute coronary syndromes (ACS), and the data suggest uses for stratifying risk in HF (3)(5). Measurement of natriuretic peptides [brain natriuretic peptide (BNP), and its amino-terminal fragment (NT-proBNP)] may be useful for estimating short- and longer-term risk following an acute HF episode (6)(7)(8), but the positive predictive value of natriuretic peptides alone for predicting hazard is modest at best. Small studies have also examined the utility of serum troponins for predicting risk in HF patients. Notably, troponin concentrations are frequently increased in HF patients in the absence of clinically evident ACS and are correlated with intermediate- and longer-term outcomes (9)(10)(11)(12)(13)(14). To examine the phenomenon of cardiac troponin T (cTnT) release in acute HF and to evaluate the prognostic value of measuring natriuretic peptide (both NT-proBNP and BNP) and cTnT concentrations for assessing risk in acute HF, we used the resources of the recently published ProBNP Investigation of Dyspnea in the Emergency Department (PRIDE) study (15).
Materials and Methods
The institutional review board approved all study procedures. The recently published PRIDE study (15) was a prospective trial that examined NT-proBNP testing for diagnosing acute HF in 599 patients who presented with dyspnea to the Emergency Department of Massachusetts General Hospital over a 4-month period. Importantly, clinically evident ACS (defined by severe ischemic changes on the electrocardiogram) was an exclusion criterion for the PRIDE study.
In the PRIDE study, the final diagnosis of acute HF was determined by study physicians blinded to each patient’s NT-proBNP value. To assign a diagnosis of acute decompensated HF as the cause of the presentation, the study physicians had access to all patient records from the time of patient enrollment through 1 year following presentation. The study physicians also determined the presence of ACS with established guidelines (16). Of the 599 enrolled patients, acute HF was judged the cause of the presentation in 209 patients (35%). These individuals were eligible for the present analysis, which focuses only on the patients with acute HF. One-year follow-up was completed for 100% of the individuals with acute HF.
cardiac marker testing
At enrollment, a blood sample was collected into EDTA-containing tubes for blinded testing of NT-proBNP and BNP. Blood samples were processed immediately and frozen at –80 °C. Both NT-proBNP and BNP testing were carried out immediately following the active recruitment phase of the PRIDE study, which occurred from March through September 2003. We used standard methods: NT-proBNP was measured on a Roche Elecsys® 1010 platform (Roche Diagnostics, Indianapolis, IN; interrun CV 0.9% at 125 ng/L), BNP was measured on a Bayer ADVIA Centaur platform (interrun CV, 2.9% at 50 ng/L), and cTnT was measured on a Roche Elecsys® 2010 platform (Roche Diagnostics; interrun CV, 5.6%). The 99th percentile of nonpathologic concentrations for cTnT reportedly is 0.01 μg/L, and the manufacturer-reported CV for the assay used in this analysis was <10% at a 0.03-μg/L cutoff point (17)(18)(19)(20).
An unblinded cTnT measurement was made for 157 (75%) of the patients with acute HF as part of the standard of care. For the remaining individuals, cTnT was measured following study completion with the blood samples collected at enrollment. NT-proBNP, BNP, and cTnT were measured with blood subjected to a single freeze-thaw cycle, and none of the samples measured were hemolyzed.
statistical analysis
We used χ2 tests for categorical data and the Wilcoxon rank sum test for continuous data in comparing clinical characteristics of patients with and without increased cTnT values. To examine the relationship between NT-proBNP, BNP, and cTnT values, we log-transformed the results for the 3 analytes to achieve normality and used bivariate analyses to evaluate the relationships between the log-transformed values.
mortality analysis
nt-probnp, bnp, and ctnt
We used ROC curves to examine the relationship between the NT-proBNP, BNP, and cTnT results and both 60-day and 1-year all-cause mortality in patients with acute HF. Following ROC curve construction, we evaluated the area under the ROC curves (AUC) for the various analytes. We conducted ROC curve analyses with Analyze-It software to identify optimal cutoff points for predicting mortality.
Patients were subsequently divided into natriuretic peptide concentration categories, which were then evaluated with respect to cTnT concentration by means of optimal cutoff points for mortality at each step. We generated 4 groups: the concentration of neither marker increased, increased natriuretic peptide and low cTnT concentrations, increased cTnT and low natriuretic peptide concentrations, and increased natriuretic peptide and cTnT concentrations. Crude 60-days and 1-year mortality rates were compared for these 4 groups. We then constructed hazard curves to evaluate mortality rates for each category and analyzed differences in mortality rates among the groups with the log-rank test.
multivariate analyses
To identify independent predictors of death at 1 year following presentation with acute destabilized HF, we constructed age-adjusted Cox models to examine clinical variables of interest and used 1-year mortality as the dependent variable. All covariates associated with 1-year mortality that had age-adjusted P values <0.05 were potentially eligible for inclusion in the final multivariable Cox model. This model was selected by stepwise Cox regression with a P value of <0.05 as the cutoff for retention in the model. The results of the final multivariable model are presented as hazards ratios (HR) with 95% confidence intervals (CI). The proportion of hazards was checked and found to be appropriate.
We performed all statistical analyses with SPSS software (SPSS). All P values represent results of 2-sided tests, with results <0.05 considered.
Results
Patients were enrolled from March to September 2003. Demographic features, clinical characteristics, and laboratory values of all the HF patients by cTnT status are summarized in Table 11 . Nearly half (96 of 209, 46%) of the patients who presented with acute HF had detectable cTnT concentrations (≥0.01 μg/L; range, 0.01–4.70 μg/L). We measured cTnT values ≥0.03 μg/L (cutoff point for myocardial injury associated with a CV of <10%) in 69 (33%) of the HF patients, and 28 patients (13%) had cTnT values ≥0.10 μg/L (the previous ROC-defined threshold for the definitive diagnosis of acute myocardial infarction). No patient had an admitting diagnosis of ACS; however, 7% of the patients ultimately received an ACS diagnosis subsequent to presentation.
The HF patient group with increased cTnT concentrations did not differ from HF patients without increased cTnT concentrations in terms of age, body mass index, or male-female ratio, but median plasma concentrations of natriuretic peptides in the former group were ∼3 times higher [NT-proBNP, 7703 ng/L vs 2287 ng/L (P <0.001); BNP, 544 ng/L vs 221 ng/L (P <0.001)]. This group also had clinically more severe HF. Furthermore, patients with detectable cTnT concentrations had a higher prevalence of co-morbidities, such as diabetes (P = 0.002), coronary artery disease (CAD) (P = 0.03), impaired renal function (P <0.001), and a lower ejection fraction (P <0.001). They were also more likely to have had prior HF (P = 0.002). The relatively low overall rate of cardiac medication use reflected the new-onset nature of the HF in many of the patients. Nonetheless, there were significant univariable differences between survivors and nonsurvivors among the cTnT-positive acute HF patients in the rates of use of any beta-blocker from hospital presentation through the time of hospital discharge (78% and 36%, respectively; P = 0.001 for difference). Similarly, cTnT-positive survivors and nonsurvivors showed a univariable difference in the rate of aspirin use from presentation through discharge (92% and 72%, respectively; P = 0.008).
Compared with the patients who survived (see Table 1 in the Data Supplement that accompanies the online version of this article at http://www.clinchem.org/content/vol53/issue3), patients who died by 60 days presented with higher median cTnT concentrations (0.03 μg/L vs <0.01 μg/L, P = 0.009), higher median concentrations of NT-proBNP (9332 ng/L vs 3511 ng/L, P = 0.02) and BNP (589 ng/L vs 352 ng/L, P = 0.05), higher prevalences of diabetes mellitus (22% vs 3.4%, P = 0.001) and aspirin use (56% vs 33%, P = 0.002), and lower creatinine clearance values [46.3 (18.5) mL · min–1 · (1.73 m2)–1 vs 67.4 (26.0) mL · min–1 · (1.73 m2)–1; P <0.001].
Similarly, the patients who had died by 1 year (see Table 1 in the online Data Supplement) were typically older, had more prevalent CAD and/or prior myocardial infarction, had more severe HF symptoms and signs, had a lower body mass index, and were more likely to have a worse renal function and higher NT-proBNP, BNP, and cTnT concentrations (P <0.05 for each analyte).
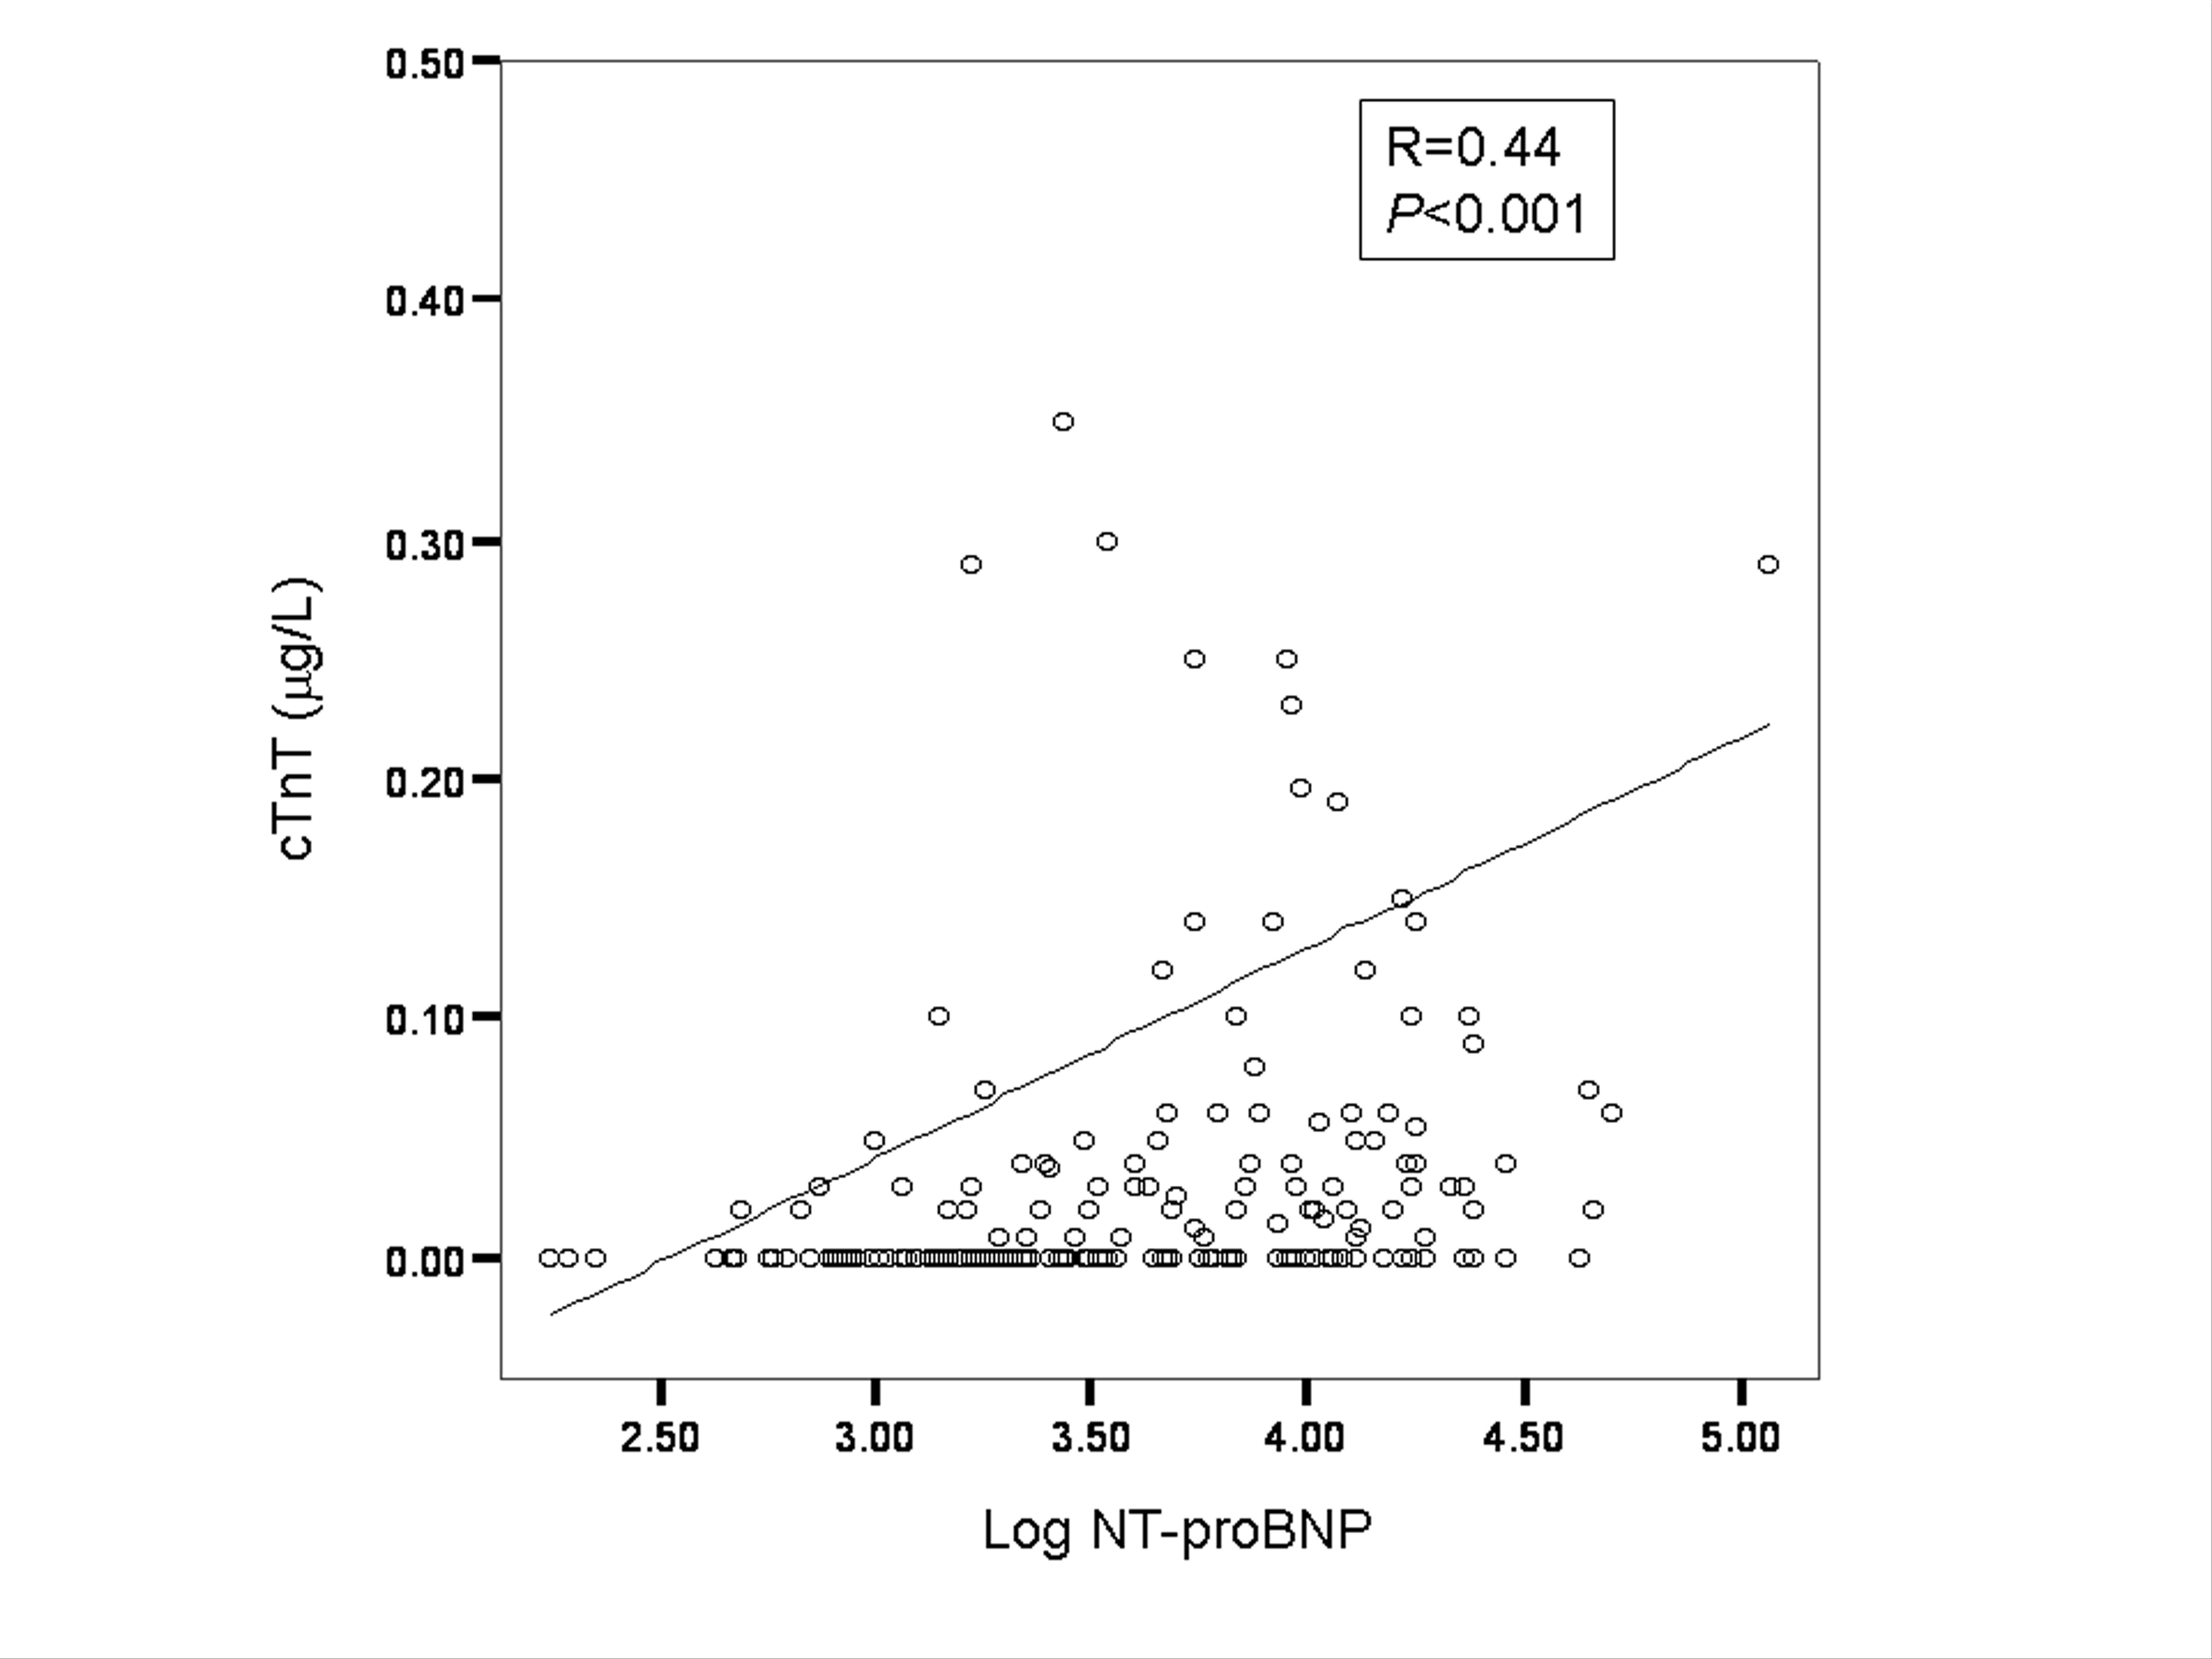
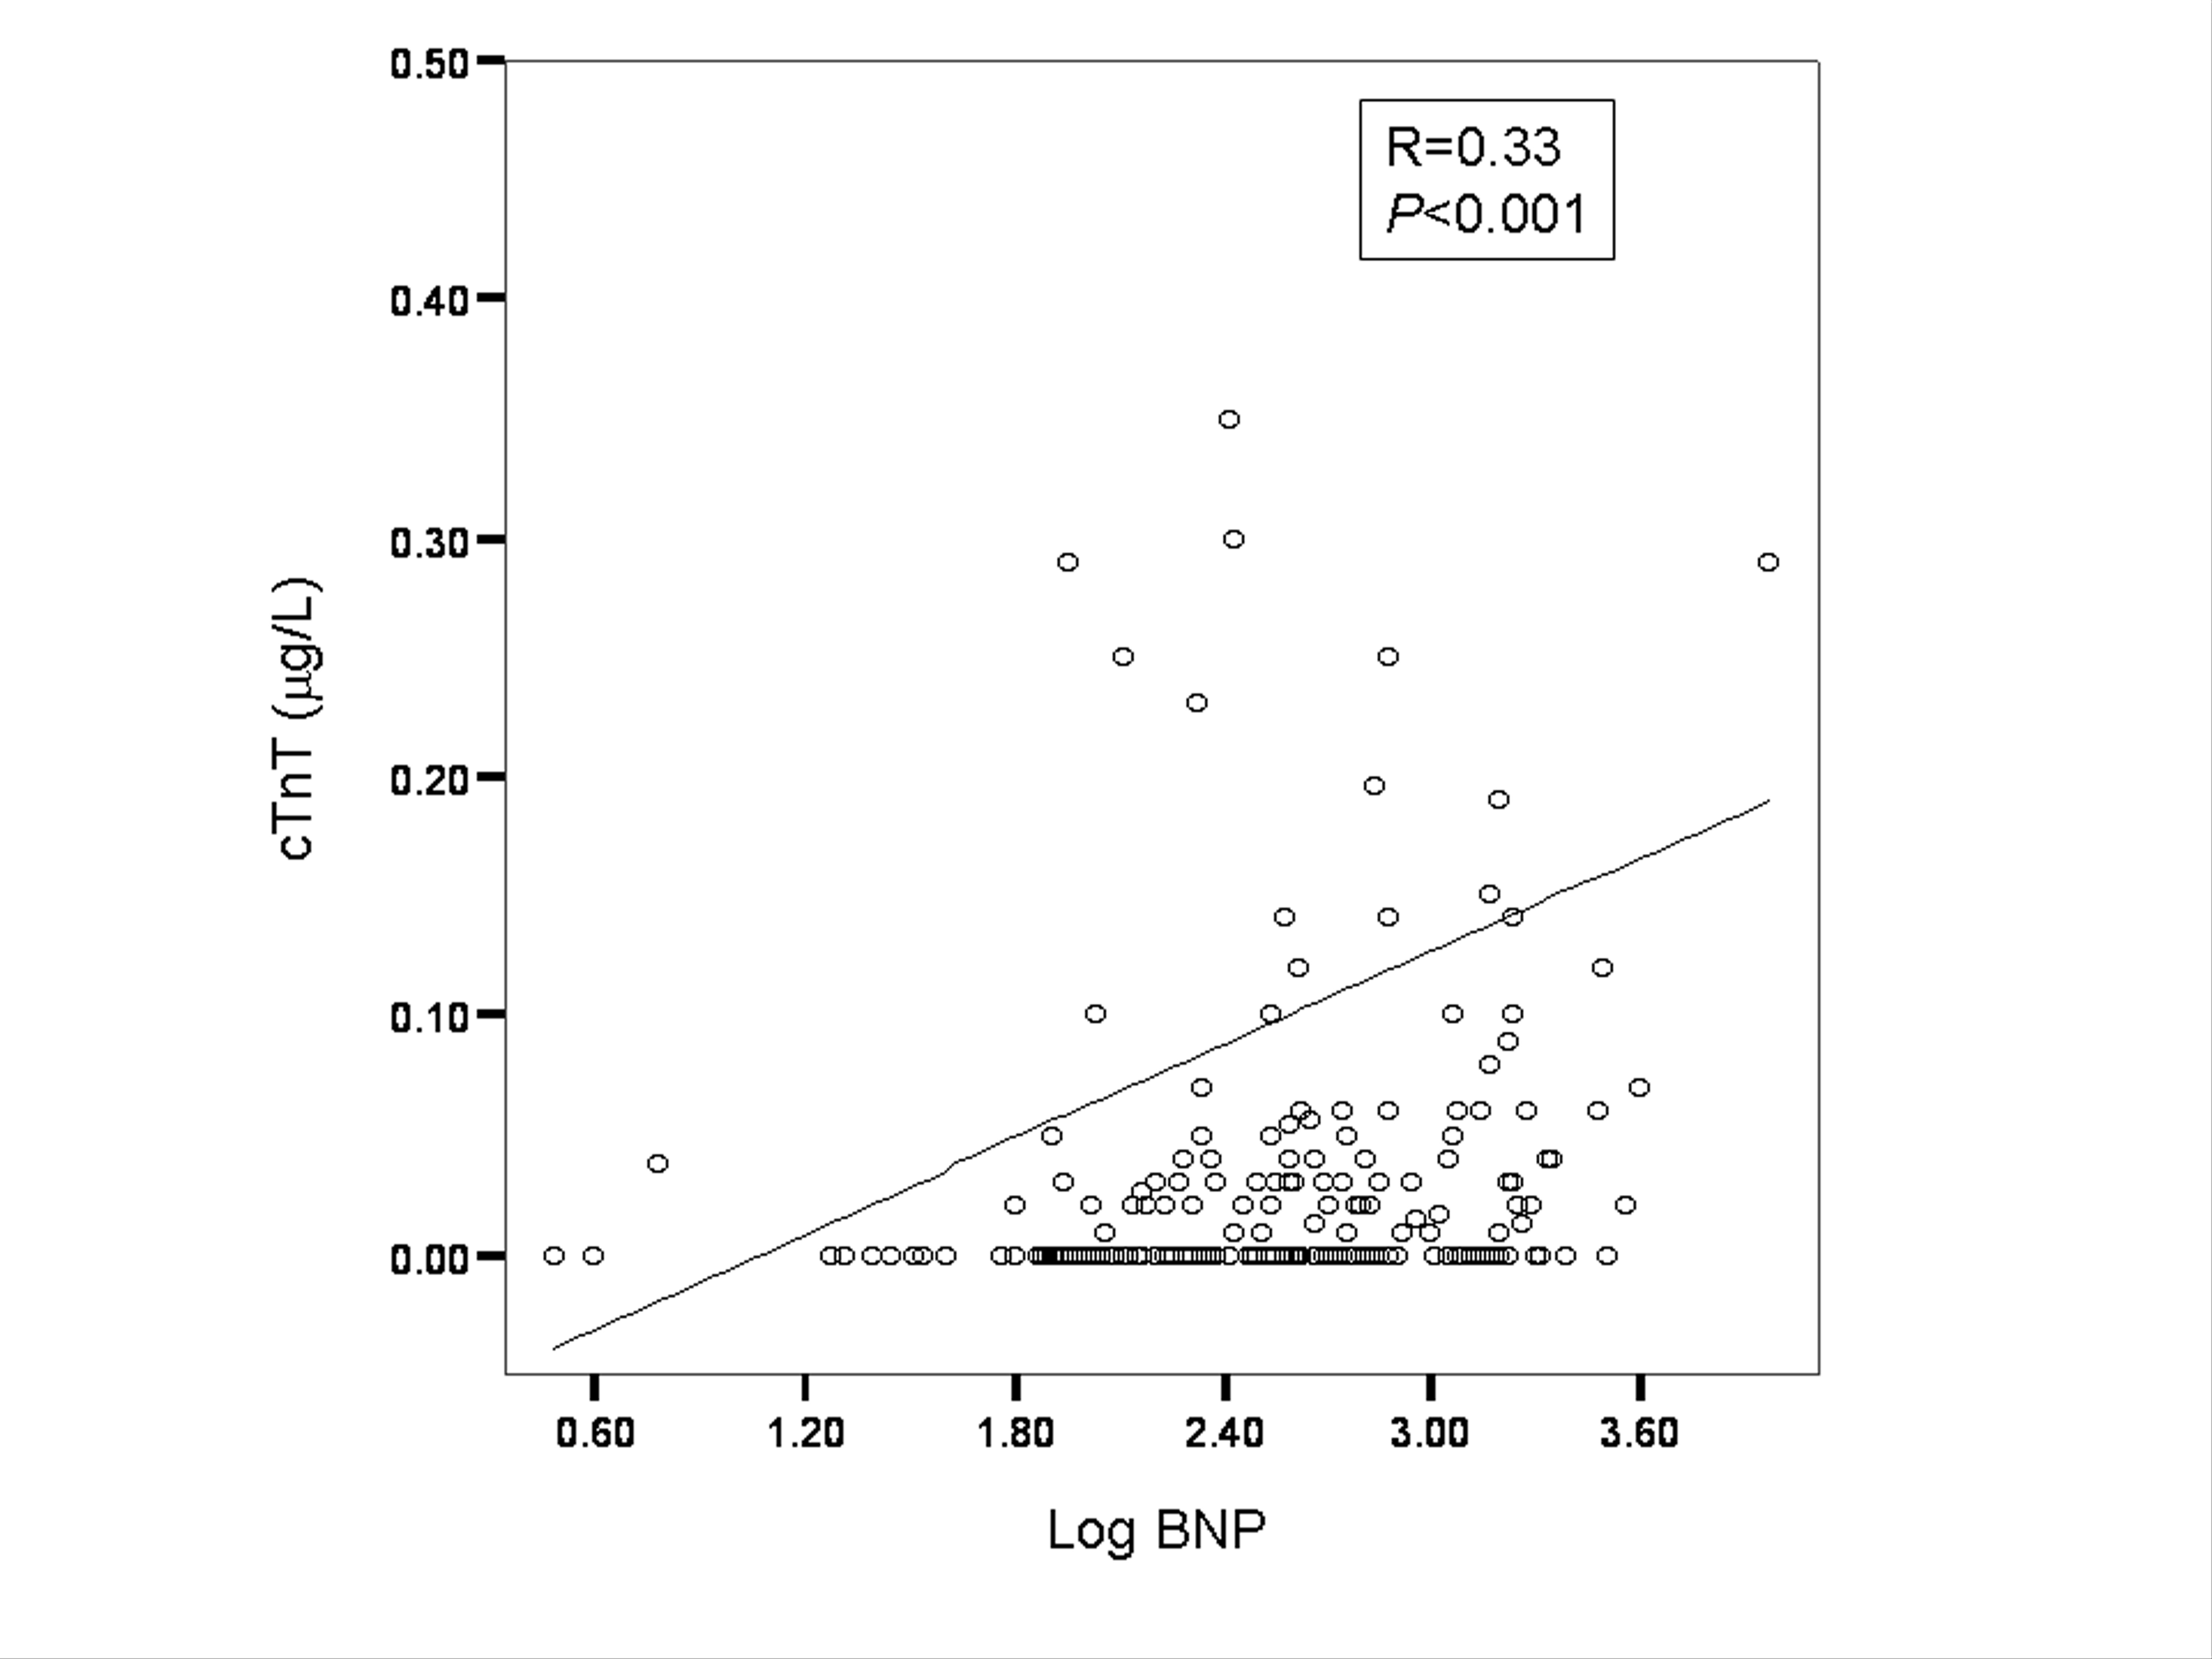
In a bivariate correlation analysis, we found positive correlations between cTnT concentration and log-transformed concentrations of NT-proBNP (r = 0.44; P <0.001) and BNP (r = 0.33; P <0.001) (see Fig. 1 in the online Data Supplement). As expected, we also found a significant relationship between log-transformed NT-proBNP and BNP concentrations (r = 0.81; P <0.001) and a modest but significant relationship between the log-transformed cTnT concentration and the left ventricular ejection fraction (r = –0.204; P = 0.003).
We used ROC curve analysis to assess the NT-proBNP, BNP, and cTnT markers with respect to 60-day mortality (Fig. 11 ). For NT-proBNP, the AUC for predicting mortality by 60 days was 0.67 (95% CI, 0.53–0.80; P <0.0001); a cutoff point of 5563 ng/L yielded a 75% sensitivity (95% CI, 48%–93%), a 60% specificity (95% CI, 53%–67%) (Table 22 ), and a 97% negative predictive value (NPV). For BNP, the AUC for 60-day mortality was 0.61 (95% CI, 0.48–0.75; P <0.0001). The difference between the AUC for the 2 analytes was statistically significant (P = 0.05). The optimal BNP cutoff point in ROC analyses for predicting 60-day mortality was 428 ng/L, which yielded a 69% sensitivity (95% CI, 41%–89%), a 58% specificity (95% CI, 51%–65%), and a 96% NPV.
For cTnT (Fig. 1B1 ), the AUC for predicting mortality by 60 days was 0.68 (95% CI, 0.54–0.81; P = 0.003); the optimal cutoff point for predicting mortality from ROC analyses (Table 22 ) was 0.01 μg/L, yielding a 55% sensitivity (95% CI, 43%–67%), a 63% specificity (95% CI, 55%–71%), and a 75% NPV.
We also used ROC curve analyses to assess the utility of NT-proBNP, BNP, and cTnT concentrations for predicting mortality by 1 year (Figs. 1C1 and 1D1 ). For NT-proBNP, the AUC for 1-year mortality was 0.67 (95% CI, 0.58–0.74; P <0.0001); a cutoff point of 3174 ng/L yielded a 75% sensitivity (95% CI, 62%–86%), a 51% specificity (95% CI, 43%–59%), and an 85% NPV. For BNP, the AUC for mortality by 1 year was 0.64 (95% CI, 0.55–0.72; P <0.0001); the difference between the AUC for the 2 analytes was not statistically significant (P = 0.35). The optimal BNP cutoff point in the ROC analyses for predicting death by 1 year was 352 ng/L, yielding a 70% sensitivity (95% CI, 56%–81%), a 55% specificity (95% CI, 47%–63%), and an 83% NPV.
The AUC for predicting 1-year mortality for cTnT (Fig. 1D1 ) was 0.61 (95% CI, 0.53–0.70; P = 0.004); the optimal cutoff point was also 0.01 μg/L (Table 22 ), which yielded a 59% sensitivity (95% CI, 45%–72%), a 63% specificity (95% CI, 55%–71%), and an 81% NPV. As expected, we identified a positive association between increasing cTnT values and mortality rate at 1 year: <0.01 μg/L, 18.6% 1-year mortality rate (n = 113); 0.01–0.03 μg/L, 29.6% (n = 27); 0.03–0.09 μg/L, 41.5% (n = 41); and ≥0.10 μg/L, 35.7% (n = 28).
Although a cTnT concentration ≥0.01 μg/L was statistically significant in univariate analyses (HR, 4.70; 95% CI, 1.40–15.3; P = 0.01), cTnT values did not independently predict 1-year mortality in a multivariate Cox analysis that included NT-proBNP concentration (HR, 2.65; 95% CI, 0.85–9.65; P = 0.09). On the other hand, an NT-proBNP concentration greater than the optimal ROC cutoff point for predicting death by 1 year (i.e., 3174 ng/L) nearly tripled the risk of death at 1 year (HR, 2.76; 95% CI, 1.62–5.36; P = 0.004) in patients presenting with acute HF. We obtained similar results with a BNP concentration greater than the optimal cutoff point (352 ng/L) in the ROC curve analysis (HR, 2.53; 95% CI, 1.53–6.21; P = 0.008). Importantly, although a detectable cTnT concentration was not independently associated with mortality at 1 year, it significantly increased the attributable risk of an NT-proBNP or BNP concentration at this time point; thus, the strongest predictor of death at 1 year resulted from a combined increase in NT-proBNP and cTnT concentrations (HR, 7.66; 95% CI, 3.06–17.8; P <0.001) or in BNP and cTnT concentrations (HR, 6.82; 95% CI, 2.99–16.5; P <0.001). In the presence of combined increases in natriuretic peptide and cTnT concentrations, the other factors independently predictive of death by 1 year were age (HR, 1.16; 95% CI, 1.08–1.30; P = 0.002), glomerular filtration rate decile (HR, 0.84; 95% CI, 0.20–0.90; P = 0.005), and New York Heart Association class (HR, 1.40; 95% CI, 1.06–1.92; P = 0.008).
We observed different crude death rates as a function of cardiac marker concentrations at both 60 days and 1 year (Fig. 22 ). Most of the patients who had died by 60 days had increases in both marker classes. By 1 year, higher death rates were observed for patients with increased natriuretic peptide concentrations (with or without a high cTnT concentration), but death rates were considerably higher among patients with increases in concentrations of both marker classes. Patients with increases in both the NT-proBNP or BNP concentration and the cTnT concentration at presentation had mortality rates that approached 20% at 60 days and 45% at 1 year.
Cumulative hazard curves, with acute HF expressed as a function of NT-proBNP, BNP, and cTnT category, are displayed in Fig. 33 . Relative to patients with natriuretic peptide or cTnT concentrations below the prognostic threshold or with an isolated increase in either NT-proBNP/BNP or cTnT, patients with both natriuretic peptide and cTnT concentrations greater than their 1-year prognostic thresholds had the highest death rates, which increased early after presentation and continued to rise throughout the year of follow-up.
Discussion
Recent studies have demonstrated a prognostic role for troponins and natriuretic peptides in HF (6)(7)(8)(9)(10)(11)(12)(13)(14)(21)(22)(23)(24), yet the optimal mode for applying these markers to assess short- and longer-term mortality risk in acute HF remains unclear. Because the PRIDE study focused on patients without evident ACS at enrollment, it afforded an opportunity to analyze the relationship between natriuretic peptide testing and cTnT in HF without superimposed overt ischemic cardiac events. We found that an optimal biomarker strategy for predicting 60-day and 1-year risk of death in acute HF patients was to combine widely available assays for NT-proBNP or BNP with a cTnT assay. This approach afforded better sensitivity for predicting fatal events than the use of either marker class individually.
Ample evidence has demonstrated the value of natriuretic peptides for predicting adverse outcomes, and our data confirm that NT-proBNP or BNP values determined in the emergency department setting have strong prognostic value in acute HF. A multimarker testing strategy has been suggested for evaluating ACS patients (4), but for patients with acute HF, early studies of the short- and longer-term prognostic value of combining troponin testing with natriuretic peptide testing have yielded contradictory results (12)(21)(25)(26)(27). Our data demonstrate that most patients who died by 60 days were best identified with both a natriuretic peptide assay and a cTnT assay, even in the absence of clinically evident ACS. Although we did find a relationship between natriuretic peptide concentration and the likelihood of death by 1 year, the attributable risk of mortality was greater in the context of an increased cTnT concentration.
The many mechanisms of natriuretic peptide release in acute HF, including myocyte stretch, tissue ischemia, and cardiac remodeling (28)(29)(30), indicate why these markers are so profoundly prognostic in HF patients. The increase in attributable risk associated with the addition of an increased cTnT concentration to an increased natriuretic peptide concentration suggests that the pathophysiology underlying the risk to patients with acute HF is heterogeneous.
One possible explanation is that increased cTnT values represent an acute subendocardial ischemic component to HF that produces concurrent increases in wall stress (reflected by NT-proBNP or BNP release) and risk for severe decompensation and death. The relationship between increased cTnT values and diabetes mellitus and impaired renal function (with attendant risk for more diffuse small-vessel disease) suggests that myocardial necrosis is related to small- or large-vessel atherosclerosis. Thus, cTnT release might have been related to epicardial CAD in some of our cases; however, most of our patients had no clinically evident ACS or incident/prevalent CAD.
In the absence of CAD, a second possibility is that an increased cTnT concentration reflects another process, such as myocyte apoptosis or necrosis. Supporting this concept is the identification of myocyte apoptosis and necrosis as a pathophysiologic mechanism in HF (31). This mechanism may be independent of CAD and may be related to endogenous catecholamine-mediated injury (32).
A strength of our study is that it considers 2 different automated natriuretic peptide assays currently in clinical use. Our results demonstrate that both NT-proBNP and BNP tests provide comparable longer-term prognostic value in acute HF, although ROC testing suggests that NT-proBNP is somewhat superior to BNP for predicting shorter-term death. Despite the comparability of test results, we emphasize that these 2 methods have differences in imprecision, turn-around time, and costs (17)(18)(19)—all important considerations in the choice of a method.
Limitations involving the individual analytes and the methods tested in this study are worthy of mention. The NT-proBNP assay produces significantly lower values in EDTA-containing plasma than in serum samples (17)(33), so it is necessary to consider the optimal NT-proBNP cutoff points identified in this study in this context. Although BNP was a useful predictor of death at 1 year, we remind the reader that BNP measurements were done with blood samples that were frozen for up to 6 months and then subjected to a freeze-thaw cycle. This is an important consideration because BNP is less stable than NT-proBNP when stored frozen (34). Troponin is stable when subjected to freeze-thaw cycles (35). It is difficult to completely exclude the possibility that the observed increases in cTnT are related to ACS, although a clinically evident ACS represented a major exclusion criterion for the study; however, the negative prognostic impact of cTnT remained when it was controlled for the presence of ACS, prior CAD, and prior ischemic cardiovascular events. Because renal function was worse in patients with increased cTnT values, the higher cTnT concentrations in these individuals might simply reflect decreased clearance of the marker in the context of a reduced renal function. Importantly, cTnT remains a powerful predictor of adverse outcomes, even in the presence of impaired renal function, presumably because this marker has a superior ability to detect subtle myocardial injury states in the patient with an impaired kidney function (36). Troponin I was not evaluated; however, it presumably has the same relationship to HF as cTnT. Lastly, our optimal cTnT cutoff point for predicting death was 0.01 μg/L, which is the 99th percentile value for nonpathologic populations (20). The CV for the cTnT method is as high as 20% at this cutoff point (37), but the assay’s imprecision may not affect the utility of troponins for prognostication (38). We also point out that the 0.01-μg/L cutoff point has been recently suggested as an inflection point for risk in ACS patients and in the general population (39)(40). The relatively high imprecision values at low cTnT concentrations may explain why cTnT did not independently predict death in our cohort in the presence of a natriuretic peptide result. The dissemination of more precise and more sensitive troponin assays may generate the appropriate troponin cutoff point for risk prediction.
Our data indicate that combining the widely available cardiac biomarkers cTnT and NT-proBNP or BNP is better than either class of marker alone for identifying the risk of death from presentation to at least 1 year following presentation. A multimarker approach for risk stratification in acute HF therefore appears promising, particularly in light of the widespread use of troponins and natriuretic peptides in clinical medicine. The relevant challenge at this point is to establish the proper approach to patients with the combined increases in natriuretic peptide and cTnT concentrations.
Patient characteristics expressed as a function of troponin status.
| Characteristic | Increased cTnT1 (n = 96) | No Increased cTnT (n = 113) | P |
|---|---|---|---|
| Age, years2 | 74.3 (11.6) | 71.4 (14.9) | 0.14 |
| Male sex, | 58 | 45 | 0.07 |
| New York Heart Association class | < 0.001 | ||
| II | 10 | 19 | |
| III | 32 | 36 | |
| IV | 58 | 45 | |
| Past medical history | |||
| Cardiomyopathy | 26 | 14 | 0.05 |
| Arrhythmia | 30 | 34 | 0.77 |
| Hypertension | 71 | 56 | 0.13 |
| Diabetes mellitus | 18 | 3.6 | 0.002 |
| Coronary artery disease | 52 | 34 | 0.03 |
| Myocardial infarction | 26 | 16 | 0.06 |
| Congestive heart failure | 69 | 42 | < 0.001 |
| Medications at presentation | |||
| Beta-blocker | 63 | 50 | 0.08 |
| Loop diuretic | 62 | 50 | 0.16 |
| Digoxin | 25 | 20 | 0.62 |
| Angiotensin-converting enzyme inhibitor | 30 | 35 | 0.49 |
| Angiotensin receptor blocker | 6.3 | 8.8 | 0.59 |
| Aspirin | 55 | 35 | 0.03 |
| Nitrate | 17 | 13 | 0.41 |
| Pulse rate, beats/min2 | 87 (21) | 86 (23) | 0.44 |
| Systolic blood pressure, mmHg2 | 138 (31) | 142 (29) | 0.71 |
| Body mass index2 | 27 (5.6) | 28 (7.4) | 0.98 |
| Creatinine clearance,2 mL · min−1 · (1.73 m2)−1 | 48.3 (19.3) | 66.4 (27.0) | < 0.001 |
| Creatinine, μmol/L2 | 130 (42) | 110 (35) | < 0.001 |
| Left ventricular ejection fraction2 | 45.0 (18.3) | 52.4 (17.4) | 0.008 |
| Left ventricular ejection fraction | < 0.001 | ||
| <35 | 32 | 18 | |
| 35–50 | 25 | 17 | |
| >50 | 43 | 65 | |
| NT-proBNP, ng/L3 | 7703 (3345–14354) | 2287 (1153–6025) | < 0.001 |
| BNP, ng/L3 | 544 (289–1166) | 221 (106–574) | < 0.001 |
An increased cTnT concentration was defined as ≥0.01 μg/L.
Data are presented as the mean (SD).
Data are presented as the median (interquartile range).
ROC curve analysis for mortality.
Analyses of mortality by 60 days for NT-proBNP and BNP (A), for cTnT (B), by 1 year for NT-proBNP and BNP (C), and for cTnT (D).
Candidate cutoff points for NT-proBNP, BNP, and cTnT for predicting death in patients with acute HF.1
| Analyte and time point | Optimal cutoff points | Sensitivity, % (95 CI) | Specificity, % (95 CI) | Positive Predictive Value, % | Negative Predictive Value, % |
|---|---|---|---|---|---|
| 60 Days | |||||
| NT-proBNP, ng/L | 5563 | 75 (48–93) | 60 (53–67) | 14 | 97 |
| BNP, ng/L | 428 | 69 (41–89) | 58 (51–65) | 12 | 96 |
| cTnT, μg/L | 0.01 | 55 (43–67) | 63 (55–71) | 42 | 75 |
| 1 Year | |||||
| NT-proBNP, ng/L | 3174 | 75 (62–86) | 51 (43–59) | 36 | 85 |
| BNP, ng/L | 352 | 70 (56–81) | 55 (47–63) | 36 | 83 |
| cTnT, μg/L | 0.01 | 59 (45–72) | 63 (55–71) | 37 | 81 |
Data are expressed for both short-term (60-day) and longer-term (1-year) risk.
Crude mortality rates at 60 days and 1 year as a function of NT-proBNP and cTnT concentrations (A) and BNP and cTnT concentrations (B).
For ease of presentation, optimal cutoff points for the natriuretic peptides are presented in Table 22 .
Cumulative hazard curves demonstrating the relationship between NT-proBNP and cTnT concentrations (A) and between BNP and cTnT concentrations (B) at presentation relative to mortality frequency from presentation to 1 year.
The optimal natriuretic peptide cutoff concentration used for this analysis was for a 1-year hazard (details in Table 22 ).
Nonstandard abbreviations: HF, heart failure; NT-proBNP, amino-terminal pro–brain natriuretic peptide; BNP, brain natriuretic peptide; cTnT, cardiac troponin T; HR, hazard ratio; CI, confidence interval; CAD, coronary artery disease; ACS, acute coronary syndrome; PRIDE, ProBNP Investigation of Dyspnea in the Emergency Department; AUC, area under the ROC curve; NPV, negative predictive value.
Acknowledgments and Conflicts of Interest: This research was supported by an unrestricted grant from Roche Diagnostics. For the purposes of detailing any conflict of interest, 2 of the 5 authors (R.S., J.L.J.) have received honoraria in the past from Roche Diagnostics. E.L.L., K.B.L., and J.L.J. have received grant support and have received compensation for speaking and consulting for Roche Diagnostics.
Thom T, Haase N, Rosamond W, Howard VJ, Rumsfeld J, Manolio T, et al. Heart disease and stroke statistics–2006 update: a report from the American Heart Association Statistics Committee and Stroke Statistics Subcommittee.
Fonarow GC, Adams KF, Jr, Abraham WT, Yancy CW, Boscardin WJ. Risk stratification for in-hospital mortality in acutely decompensated heart failure: classification and regression tree analysis.
Felker GM, Leimberger JD, Califf RM, Cuffe MS, Massie BM, Adams KF, Jr, et al. Risk stratification after hospitalization for decompensated heart failure.
Sabatine MS, Morrow DA, de Lemos JA, Gibson CM, Murphy SA, Rifai N, et al. Multimarker approach to risk stratification in non-ST elevation acute coronary syndromes: simultaneous assessment of troponin I, C-reactive protein, and B-type natriuretic peptide.
Fonarow GC, Horwich TB. Combining natriuretic peptides and necrosis markers in determining prognosis in heart failure.
Bettencourt P, Azevedo A, Pimenta J, Frioes F, Ferreira S, Ferreira A. N-terminal-pro-brain natriuretic peptide predicts outcome after hospital discharge in heart failure patients.
Januzzi JL, Jr, Sakhuja R, O’Donoghue M, Baggish AL, Anwaruddin S, Chae CU, et al. Utility of amino-terminal pro-brain natriuretic peptide testing for prediction of 1-year mortality in patients with dyspnea treated in the emergency department.
Januzzi JL, van Kimmenade R, Lainchbury J, Bayes-Genis A, Ordonez-Llanos J, Santalo-Bel M, et al. NT-proBNP testing for diagnosis and short-term prognosis in acute destabilized heart failure: an international pooled analysis of 1256 patients: the International Collaborative of NT-proBNP Study.
La Vecchia L, Mezzena G, Zanolla L, Paccanaro M, Varotto L, Bonanno C, et al. Cardiac troponin I as diagnostic and prognostic marker in severe heart failure.
Missov E, Mair J. A novel biochemical approach to congestive heart failure: cardiac troponin T.
Perna ER, Macin SM, Parras JI, Pantich R, Farias EF, Badaracco JR, et al. Cardiac troponin T levels are associated with poor short- and long-term prognosis in patients with acute cardiogenic pulmonary edema.
Sato Y, Taniguchi R, Makiyama T, Nagai K, Okada H, Yamada T, et al. Serum cardiac troponin T and plasma brain natriuretic peptide in patients with cardiac decompensation.
Sato Y, Yamada T, Taniguchi R, Nagai K, Makiyama T, Okada H, et al. Persistently increased serum concentrations of cardiac troponin t in patients with idiopathic dilated cardiomyopathy are predictive of adverse outcomes.
Setsuta K, Seino Y, Takahashi N, Ogawa T, Sasaki K, Harada A, et al. Clinical significance of elevated levels of cardiac troponin T in patients with chronic heart failure.
Januzzi JL, Jr, Camargo CA, Anwaruddin S, Baggish AL, Chen AA, Krauser DG, et al. The N-terminal Pro-BNP Investigation of Dyspnea in the Emergency Department (PRIDE) Study.
Alpert JS, Thygesen K, Antman E, Bassand JP. Myocardial infarction redefined–a consensus document of The Joint European Society of Cardiology/American College of Cardiology Committee for the redefinition of myocardial infarction.
Collinson PO, Barnes SC, Gaze DC, Galasko G, Lahiri A, Senior R. Analytical performance of the N terminal pro B type natriuretic peptide (NT-proBNP) assay on the Elecsys 1010 and 2010 analysers.
Prontera C, Emdin M, Zucchelli GC, Ripoli A, Passino C, Clerico A. Analytical performance and diagnostic accuracy of a fully-automated electrochemiluminescent assay for the N-terminal fragment of the pro-peptide of brain natriuretic peptide in patients with cardiomyopathy: comparison with immunoradiometric assay methods for brain natriuretic peptide and atrial natriuretic peptide.
Wu AH, Packer M, Smith A, Bijou R, Fink D, Mair J, et al. Analytical and clinical evaluation of the Bayer ADVIA Centaur automated B-type natriuretic peptide assay in patients with heart failure: a multisite study.
Apple FS, Parvin CA, Buechler KF, Christenson RH, Wu AH, Jaffe AS. Validation of the 99th percentile cutoff independent of assay imprecision (CV) for cardiac troponin monitoring for ruling out myocardial infarction.
Bertinchant JP, Combes N, Polge A, Fabbro-Peray P, Raczka F, Beck L, et al. Prognostic value of cardiac troponin T in patients with both acute and chronic stable congestive heart failure: comparison with atrial natriuretic peptide, brain natriuretic peptide and plasma norepinephrine.
Del Carlo CH, Pereira-Barretto AC, Cassaro-Strunz C, Latorre Mdo R, Ramires JA. Serial measure of cardiac troponin T levels for prediction of clinical events in decompensated heart failure.
Gardner RS, Ozalp F, Murday AJ, Robb SD, McDonagh TA. N-terminal pro-brain natriuretic peptide. A new gold standard in predicting mortality in patients with advanced heart failure.
Hartmann F, Packer M, Coats AJ, Fowler MB, Krum H, Mohacsi P, et al. Prognostic impact of plasma N-terminal pro-brain natriuretic peptide in severe chronic congestive heart failure: a substudy of the Carvedilol Prospective Randomized Cumulative Survival (COPERNICUS) trial.
Horwich TB, Patel J, MacLellan WR, Fonarow GC. Cardiac troponin I is associated with impaired hemodynamics, progressive left ventricular dysfunction, and increased mortality rates in advanced heart failure.
Hudson MP, O’Connor CM, Gattis WA, Tasissa G, Hasselblad V, Holleman CM, et al. Implications of elevated cardiac troponin T in ambulatory patients with heart failure: a prospective analysis.
Ishii J, Nomura M, Nakamura Y, Naruse H, Mori Y, Ishikawa T, et al. Risk stratification using a combination of cardiac troponin T and brain natriuretic peptide in patients hospitalized for worsening chronic heart failure.
Goetze JP, Gore A, Moller CH, Steinbruchel DA, Rehfeld JF, Nielsen LB. Acute myocardial hypoxia increases BNP gene expression.
Sakata Y, Yamamoto K, Masuyama T, Mano T, Nishikawa N, Kuzuya T, et al. Ventricular production of natriuretic peptides and ventricular structural remodeling in hypertensive heart failure.
Feng J, Schaus BJ, Fallavollita JA, Lee TC, Canty JM, Jr. Preload induces troponin I degradation independently of myocardial ischemia.
Todd GL, Baroldi G, Pieper GM, Clayton FC, Eliot RS. Experimental catecholamine-induced myocardial necrosis. II. Temporal development of isoproterenol-induced contraction band lesions correlated with ECG, hemodynamic and biochemical changes.
Panteghini M, Clerico A. Understanding the clinical biochemistry of N-terminal pro-B-type natriuretic peptide: the prerequisite for its optimal clinical use.
Apple FS, Panteghini M, Ravkilde J, Mair J, Wu AH, Tate J, et al. Quality specifications for B-type natriuretic peptide assays.
Pagani F, Stefini F, Chapelle JP, Lefevre G, Hanafi G, Luthe H, et al. Multicenter evaluation of the analytical performance of the Liaison troponin I assay.
deFilippi C, Wasserman S, Rosanio S, Tiblier E, Sperger H, Tocchi M, et al. Cardiac troponin T and C-reactive protein for predicting prognosis, coronary atherosclerosis, and cardiomyopathy in patients undergoing long-term hemodialysis.
Panteghini M, Pagani F, Yeo KT, Apple FS, Christenson RH, Dati F, et al. Evaluation of imprecision for cardiac troponin assays at low-range concentrations.
Kupchak P, Wu AH, Ghani F, Newby LK, Ohman EM, Christenson RH. Influence of imprecision on ROC curve analysis for cardiac markers.
Morrow DA, Cannon CP, Rifai N, Frey MJ, Vicari R, Lakkis N, et al. Ability of minor elevations of troponins I and T to predict benefit from an early invasive strategy in patients with unstable angina and non-ST elevation myocardial infarction: results from a randomized trial.
